Cancer Genomics
The Cancer Genomics Shared Resource (CGSR) provides comprehensive genomic services and many state-of-the-art technologies via the MCC Cytogenomics Shared Service and the University of Minnesota Genomics Center (UMGC).
Investigators are encouraged to utilize one or both of the resources, depending on goals of the project, whether the need is for classic cytogenetics or the newest molecular genetic sequencing assay. Contact either facility for guidance on technology selection.
Services
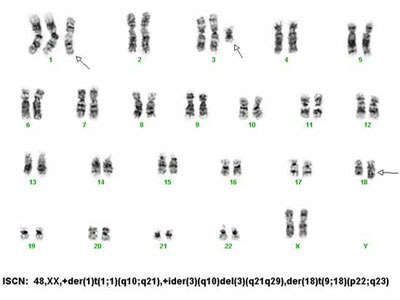
High quality G-band karyotype analyses of human, mouse, rat and swine cell lines, embryonic stem (ES) cells, induced Pluripotent Stem (iPS) cells, blood, bone marrow or fresh tissue.
Fluorescence-in-situ-hybridization (FISH) studies performed on cell lines, fresh or paraffin-embedded tissue samples, including:
- Generation of site-specific probes from genome resources BAC/PAC clones or investigator-provided DNA sequences
- Use of commercially-available probes
- Focused gene mapping of human or mouse genes using sequential G-banding and FISH and/or FISH and Spectral Karyotyping (SKY).
- Metaphase and interphase FISH analyses to investigate the presence of, or monitor, a specific chromosomal or gene rearrangement, or XX/XY chimeras.
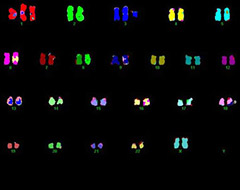
Spectral Karyotyping (SKY) multi-color FISH analyses for human, mouse and rat cell lines and tissues to identify structural chromosome abnormalities, and clarify tumor heterogeneity on a cell by cell basis